K parameter
Description
Here, a brief description of the estimation of K and the type of K plots is given. A detailed discussion on the meaning of K in SAP flow estimation can be found in [Nadezhdina, 2018] (https://doi.org/10.3832/ifor2381-011).
Estimation
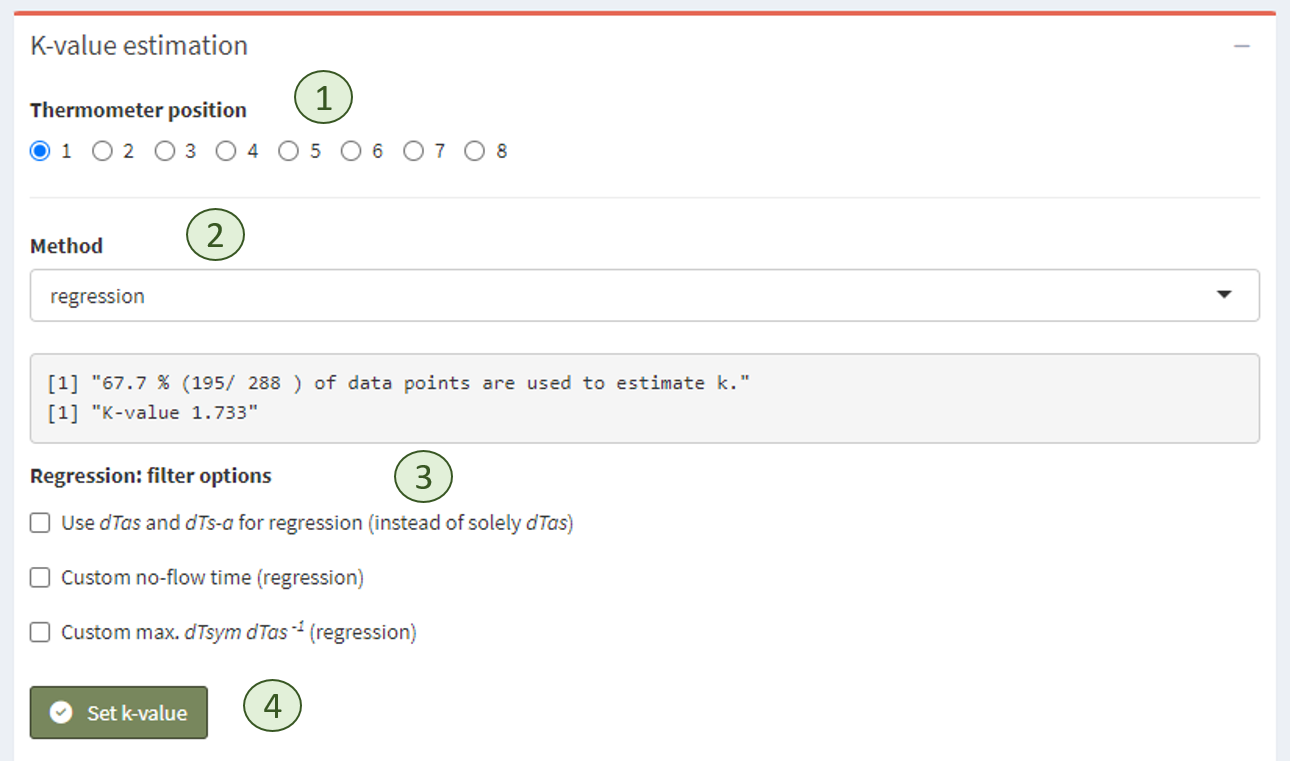
Box: K estimation settings
K must be estimated for each thermometer position. By clicking a radio button (<1>), K is estimated using the selected method (<2>) and optional filter options (<3>). If K is estimated correctly, it can be set using the ‘Set K’ button (<4>).
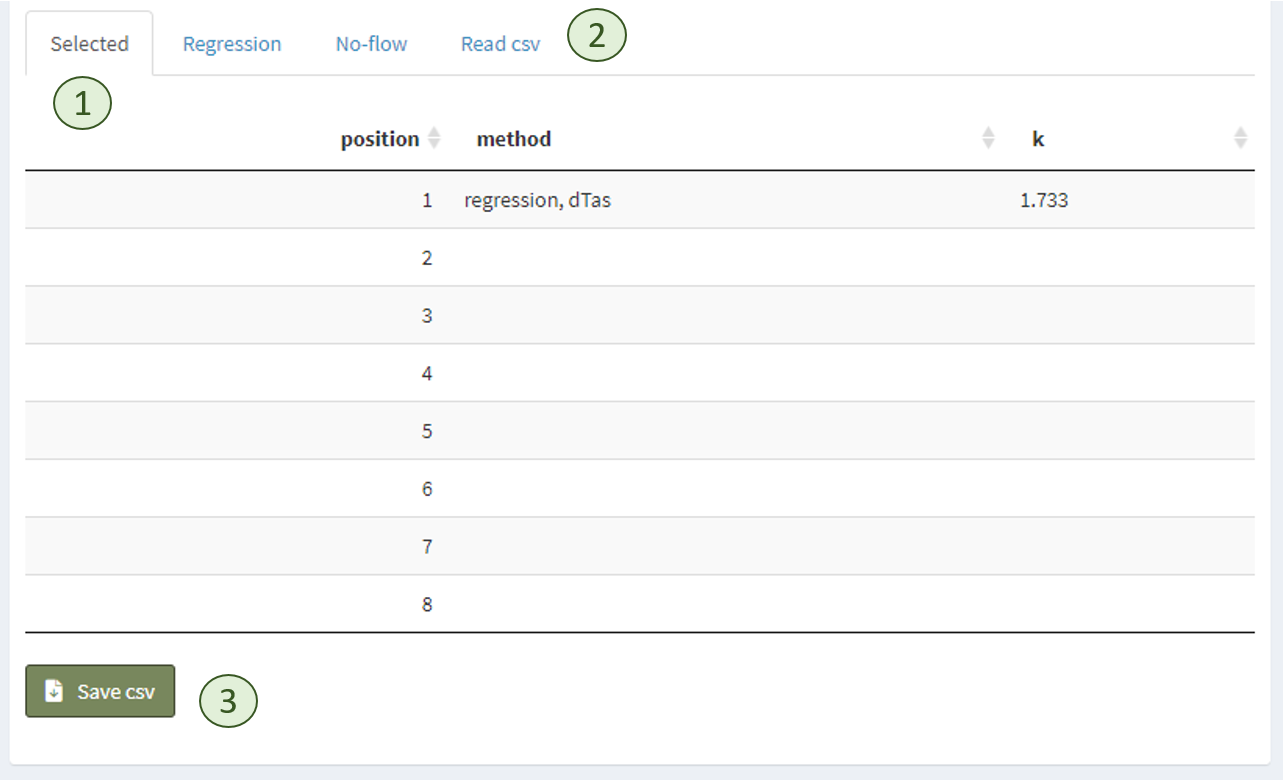
All set K values appear in the ‘Selected’ table (<1>). The other tables (<2>) provide estimates for all thermometer positions at once, obtained with each method. All regression options (figure above <3>) apply to this table as well. If the values in these tables are sufficient, they can all be set at once by clicking “Use K estimates” below the table. If K values are provided in a csv file, the file can be uploaded in the ‘Read csv’ tab (<2>). Selected Ks can also be exported as a data file (<3>).
For more information and recommendations on how to estimate K, see the Recommendations section.
Box: Control plots
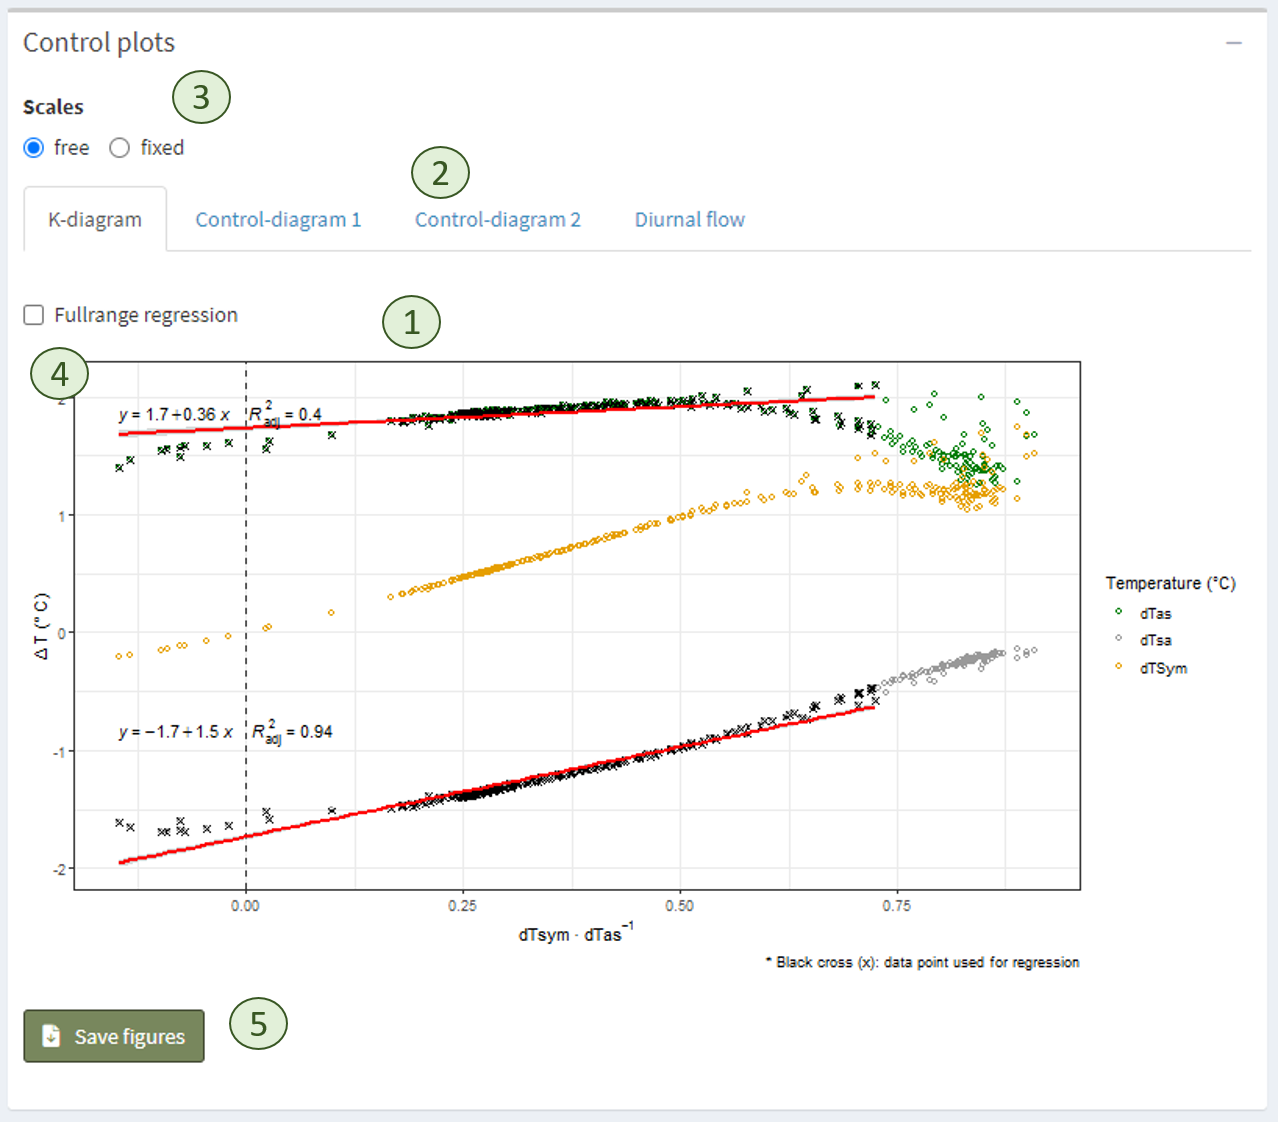
This box shows the typical K diagram (<1>) as well as two control diagrams (<2>) to assess the quality of the estimate.
It is possible to zoom in by defining the range of the x-axis variable by setting ‘Scales’ (<3>) to fixed and defining minimum and maximum values. If the ‘regression’ method is selected to estimate K, the regression line can be forced to cross the y-axis by enabling ‘Fullrange regression’ in the K-diagram
The ‘Save figures’ button (<5>) downloads the K-diagram as well as the two control diagrams for the selected thermometer position.